In the last blog we learnt saw solutions to problems from chapters 07-15. This blog is a continuation of last blog which deals with some problems from chapter 16-20.
Let us start with couple of problems of chapter 16.
*16-1
Problem :
Using the SAS data set College, compute the mean, median, minimum, and
maximum and the number of both missing and non-missing values for the variables
ClassRank and GPA. Report the statistics to two decimal places
Solution explanation : Used proc means to calculate the aove stated descriptive statistics.
 Output :

*16-5
Problem :
Using the SAS data set College, report the mean GPA for the following categories of
ClassRank: 0–50 = bottom half, 51–74 = 3rd quartile, and 75 to 100 = top
quarter. Do this by creating an appropriate format. Do not use a DATA step.
Solution explanation : Used proc format to assign the rank and then used format statement in proc means to list the ranks.


*17-7
Problem :
Using the SAS data set Blood, produce a table of frequencies for BloodType, in
frequency order.
Solution Explanation :- Used proc freq to list the records in descending order of frequency.
Table bloodtype statement is used to keep the blood type attribute with no cumulative frequencyy or percentage listed.

Output:

*18-7
Problem :
Produce the following table. Note that the keywords MIN and MAX have been
renamed and the two variables ClassRank and SchoolSize now have labels. A
procedure option was used to remove the horizontal table lines.
Solution explanation : Used proc tabulte to perform the desired action.Used tables options to calculate GPA
and label option to list different names.

*18-9
Problem :
Produce the following table. Note that the ALL column has been renamed Total,
COLPCTN has been renamed Percent, Gender has been formatted, and the order of
the columns is Yes followed by No.
Solution Explanation :- Firstly , used proc format to assign the value to gender attribute.
Ten using proc sort , sorted the records using scholarship in descending order.
Then used proc Tabulate using the procedure option ORDER=data. this is how we figure a way to place
the data set with Yes values before the No values.

Output :

*19-3
Problem :
Run the same two procedures shown in Problem 1, except create a contents file, a
body file, and a frame file.
Solution explanation : Using ODS option to send the output to html file
and then use proc means to list some descriptive statistics.


*20-7
Problem :
Using the SAS data set College, produce a vertical bar chart where the mean GPA is
shown for each value of school size (SchoolSize). Remember to include a
FMTSEARCH option, use the system option NOFMTERR, or write a format of your
own.
Solution explanation : used proc sgplot to get the vbar of mean of GPA of school size.
stat = mean option gives the mean. and fillattribute options selects the color.


*20-9
Problem :
Using the SAS data set Stocks, produce a scatter plot of Price versus Date.
Solution Explanation : using proc sgplot and option as scatter we achived our ojective.
x and y axis are specifiedafter scatter option.


I hope this blog has been of some learning experience. Thank you.
Let us start with couple of problems of chapter 16.
*16-1
Problem :
Using the SAS data set College, compute the mean, median, minimum, and
maximum and the number of both missing and non-missing values for the variables
ClassRank and GPA. Report the statistics to two decimal places
Solution explanation : Used proc means to calculate the aove stated descriptive statistics.


*16-5
Problem :
Using the SAS data set College, report the mean GPA for the following categories of
ClassRank: 0–50 = bottom half, 51–74 = 3rd quartile, and 75 to 100 = top
quarter. Do this by creating an appropriate format. Do not use a DATA step.
Solution explanation : Used proc format to assign the rank and then used format statement in proc means to list the ranks.


*17-7
Problem :
Using the SAS data set Blood, produce a table of frequencies for BloodType, in
frequency order.
Solution Explanation :- Used proc freq to list the records in descending order of frequency.
Table bloodtype statement is used to keep the blood type attribute with no cumulative frequencyy or percentage listed.

Output:

*18-7
Problem :
Produce the following table. Note that the keywords MIN and MAX have been
renamed and the two variables ClassRank and SchoolSize now have labels. A
procedure option was used to remove the horizontal table lines.
Solution explanation : Used proc tabulte to perform the desired action.Used tables options to calculate GPA
and label option to list different names.

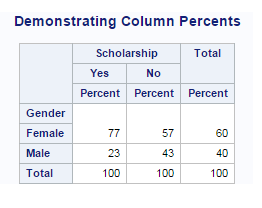
*18-9
Problem :
Produce the following table. Note that the ALL column has been renamed Total,
COLPCTN has been renamed Percent, Gender has been formatted, and the order of
the columns is Yes followed by No.
Solution Explanation :- Firstly , used proc format to assign the value to gender attribute.
Ten using proc sort , sorted the records using scholarship in descending order.
Then used proc Tabulate using the procedure option ORDER=data. this is how we figure a way to place
the data set with Yes values before the No values.

Output :
*19-3
Problem :
Run the same two procedures shown in Problem 1, except create a contents file, a
body file, and a frame file.
Solution explanation : Using ODS option to send the output to html file
and then use proc means to list some descriptive statistics.


*20-7
Problem :
Using the SAS data set College, produce a vertical bar chart where the mean GPA is
shown for each value of school size (SchoolSize). Remember to include a
FMTSEARCH option, use the system option NOFMTERR, or write a format of your
own.
Solution explanation : used proc sgplot to get the vbar of mean of GPA of school size.
stat = mean option gives the mean. and fillattribute options selects the color.


*20-9
Problem :
Using the SAS data set Stocks, produce a scatter plot of Price versus Date.
Solution Explanation : using proc sgplot and option as scatter we achived our ojective.
x and y axis are specifiedafter scatter option.


I hope this blog has been of some learning experience. Thank you.
No comments:
Post a Comment